16S预测细菌组表型-bugbase:革兰氏阴阳、生物膜、致病力、移动元件、氧气消耗等
看教程不够直观,那就看视频吧! >>点击加载视频
基于16S OTU表预测细菌表型数据库,同时可进行组间差异分析
BugBase Predicts Organism Level Microbiome Phenotypes Tonya Ward, Jake Larson, Jeremy Meulemans, Ben Hillmann, Joshua Lynch, Dimitri Sidiropoulos, John Spear, Greg Caporaso, Ran Blekhman, Rob Knight, Ryan Fink, Dan Knights bioRxiv 133462; doi: https://doi.org/10.1101/133462
此文今天5月2日发布在预印本杂志bioRxiv上面,还没有正式发表。短短几个月己被引用3次,阅读2138次,全文下载789次。待正式发表发,必将成为本领域功能预测的又一神器。
居然有33条Tweets的转发和留言,看看大家的评价:

官网:https://bugbase.cs.umn.edu/

老司机直接Parse Data上传数据开分析,新人一定要先点下方Documentation,仔细阅读使用说明。
使用说明
BugBase是一款分析微生物组样品表型的工具,此网站可以基于OTU表和Mapping files,预测大量信息和比较,包括以下七方面:
- 革兰氏阳性 Gram Positive
- 革兰氏阴性 Gram Negative
- 生物膜形成 Biofilm Forming
- 致病潜力 Pathogenic Potential
- 移动元件含量 Mobile Element Containing
- 氧的利用 Oxygen Utilizing
- 氧化胁迫耐受 Oxidative Stress Tolerant
同时BugBase还会按组进行分类统计与可视化。
输入文件要求
OTU表
- BIOM 1.0格式
- 16S以GreenGenes 13.5 为Reference
- 宏基因组以IMG为参考
- 小于15 mb (本地版无限制)
Maping File
- 制表符分隔
- 第一行必须以#SampleID起始
- 第一行全为列标题
- 第一列必须为SampleID
- 只允许使用字母、数字、下划线和连字符
- 不允许包含空格,逗号、引号、括号
- 不要包含机密信息
其实就是符合QIIME的标准即可,如下图示例 
分组列名: 指定分组信息,如上面的BODY_SITE,可产生如下结果:

还有很多其它功能,大家自己读帮助文档吧。
测试数据分析
可以点主页右边的Downloads,下载OTU表和Mapping file,
再到 Parse Data中上传这两个文件,Column Header添“BODY_SITE”,点Parse Data

很快生成了结果链接,打包下载所有结果。

本地化bugbase:安装和运行
对一直用服务器的小伙伴,肯定希望数据库有本地版,可以整合入自己的分析pipeline,随时搞,随便搞,一条命令搞定不求人。更不怕网站无法访问或无人维护。这个数据库还真可以本地方,满足muggle和geek的所有需求,安装代码如下:
源代码和数据库: https://github.com/knights-lab/BugBase
# 下载安装程序
cd ~/software
wget https://github.com/knights-lab/BugBase/archive/master.zip
mv master.zip BugBase.zip
unzip BugBase.zip
mv BugBase-master/ BugBase
# 此程序运行必须定义下面环境变量,根据实际目录修改
export BUGBASE_PATH=/home/user/software/BugBase
export PATH=$PATH:/home/user/software/BugBase/bin
安装依赖R包并显示帮助
run.bugbase.r -h  # 安装了所有依赖包
# 以上R包如果已经安装,此步可跳过
# 每次运行都会重复安装10多个包近半小时
显示程序的使用帮助如下:内容较多,只显示前四个参数,完整信息见附录1。
所有依赖包列表和安装代码见附录2
Usage: /mnt/bai/yongxin/software/BugBase/bin/run.bugbase.r [options]

Options:

-i OTUTABLE, --otutable=OTUTABLE
	otu table to plot [default NULL]

-c MAPCOLUMN, --mapcolumn=MAPCOLUMN
	column of mapping file to plot [default NULL]

-m MAPPINGFILE, --mappingfile=MAPPINGFILE
	mapping file to plot [default NULL]

-o OUTPUT, --output=OUTPUT
	output directory [default .]
运行演示数据
# 运行演示数据
run.bugbase.r -i $BUGBASE_PATH/doc/data/HMP_s15.txt -m $BUGBASE_PATH/doc/data/HMP_map.txt -c HMPBODYSUBSITE -o output
运行中会显示运行内容如下
[1] "Loading Inputs..."
[1] "16S copy number normalizing OTU table..."
[1] "Predicting phenotypes..."
[1] "313 OTUs from the input table matched the 203452 available database OTUs"
[1] "Plotting thresholds..."
[1] "Plotting predictions..."
[1] "Plotting OTU contributions..."
[1] "BugBase analysis complete"
输入参数文件详解
- OTU表 -i $BUGBASE_PATH/doc/data/HMP_s15.txt
less -S $BUGBASE_PATH/doc/data/HMP_s15.txt

# Constructed from biom file
#OTU ID SRS024625.570280        SRS018102.573993
963239  0.0     0.0     0.0     0.0     0.0     0.0
4431292 28.0    0.0     0.0     16.0    1.0     12.0
4480529 0.0     0.0     0.0     10.0    3.0     3.0
- mapping file -m $BUGBASE_PATH/doc/data/HMP_map.txt
sed -i 's/^M/\n/g' BUGBASE_PATH/doc/data/HMP_map.txt
less -S $BUGBASE_PATH/doc/data/HMP_map.txt

#SampleID       BarcodeSequence SAMP_COLLECT_DEVICE     TITLE   RUN_PREFIX      AGE     COMMON_NAME     BODY_SITE
SRS024568.571681        TCAGAATACGTTC   stool_specimen_collection_kit   HMP_production_phase_2715       SRR040712
SRS013177.574389        TCAGAGTCGAC     stool_specimen_collection_kit   HMP_production_phase_199        SRR040857
SRS020413.572892        TCAGAACCGGATAC  stool_specimen_collection_kit   HMP_production_phase_1681       SRR040994
- 分组列名 -c HMPBODYSUBSITE
输出文件详解
输出结果在线分析直接生成压缩包下载。本地在Ouput目录中有四个目录:
- normalized_otus目录中有16s_normalized_otus.txt文件,为标准化的OTU表
less -S output/normalized_otus/16s_normalized_otus.txt

# 文件如下:
        SRS024568.571681        SRS013177.574389        SRS020413.572892
963239  0       0       0       0       0       0       0       0       0
4431292 0       0       0       2       11.75   3       3       7       0
4480529 0       0       3       0       8       3       27      0       0
4345640 0       0       0       0       0       0       0       0       0
4372091 0       0       0       0       0       0       0       0       0
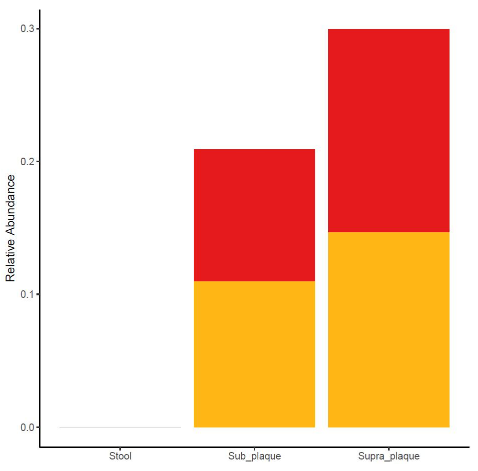
- otu_contributions目录中 主要有9种表型或功能预测结果表contributing_otus.txt,和9种表型按实验组比较的结果堆叠柱状图和物种颜色方案图例PDF版
less -S output/otu_contributions/contributing_otus.txt

# 预测结果前4行内容如下
        Aerobic Anaerobic       Contains_Mobile_Elements        Facultatively_Anaerobic Forms_Biofilms  Gram_Negative   Gram_Positive   Potentially_Pathogenic  Stress_Tolerant
963239  FALSE   TRUE    TRUE    FALSE   FALSE   FALSE   TRUE    FALSE   TRUE
4431292 FALSE   TRUE    TRUE    FALSE   FALSE   FALSE   TRUE    TRUE    TRUE
4480529 FALSE   TRUE    TRUE    FALSE   FALSE   FALSE   TRUE    FALSE   TRUE

图0. 注释物种门水平图例

图1. 各组需氧菌相对丰度

图2 各组厌氧菌相对丰度

图3. 革兰氏阴性菌相对丰度 一共有9种,不再一一列举
- predicted_phenotypes目录中 主要有9种表型或功能预测结果表predictions.txt,和9种表型按实验组比较箱线图,和相关组间统计信息。
less -S output/predicted_phenotypes/predictions.txt

        Aerobic Anaerobic       Contains_Mobile_Elements        Facultatively_Anaerobic Forms_Biofilms  Gram_Negative   Gram_Posi
SRS024568.571681        0       0.999124411409892       0.219286298011441       0       0       0.782173016305405       0.2178269
SRS013177.574389        0       1       0.185520182485371       0       0       0.82138252504215        0.17861747495785        0
SRS020413.572892        0       0.99738106419102        0.347650182422425       0.00180616262688292     0       0.687353249286566

图4. 箱线图展示9种表型中的移动元件含量
- thresholds目录中包含分析使用的阈值thresholds_used.txt和不同阈值下的结果variances.txt数据,以及9表型在不同阈值下相对丰度变化

图5. 折线图展示9种表型中的生物膜形成菌在不同阈值下相对丰度变化
Reference
- BugBase Predicts Organism Level Microbiome Phenotypes Tonya Ward, Jake Larson, Jeremy Meulemans, Ben Hillmann, Joshua Lynch, Dimitri Sidiropoulos, John Spear, Greg Caporaso, Ran Blekhman, Rob Knight, Ryan Fink, Dan Knights bioRxiv 133462; doi: https://doi.org/10.1101/133462
附录1. 程序参数详解
Usage: /mnt/bai/yongxin/software/BugBase/bin/run.bugbase.r [options]

Options:

-v, --verbose
	Print extra output [default]

-i OTUTABLE, --otutable=OTUTABLE
	otu table to plot [default NULL]

-c MAPCOLUMN, --mapcolumn=MAPCOLUMN
	column of mapping file to plot [default NULL]

-m MAPPINGFILE, --mappingfile=MAPPINGFILE
	mapping file to plot [default NULL]

-o OUTPUT, --output=OUTPUT
	output directory [default .]

-t TAXALEVEL, --taxalevel=TAXALEVEL
	taxa level to plot otu contributions by, default is
          2 (phylum) [default NULL]

-p PHENOTYPE, --phenotype=PHENOTYPE
	specific traits (phenotypes) to predict, separated by
          commas, no spaces [default NULL]

-x, --predict
	only output the prediction table, do not make plots
          [default FALSE]

-T THRESHOLD, --threshold=THRESHOLD
	threshold to use, must be between 0 and 1
          [default NULL]

-g GROUPS, --groups=GROUPS
	treatment groups of samples, separated by commas, no spaces
          [default NULL]

-u USERTABLE, --usertable=USERTABLE
	user define trait table, absolute file path required [
          default NULL]

-z, --continuous
	plot continuous data [default FALSE]

-k, --kegg
	use kegg pathway table [default FALSE]

-C, --cov
	use coefficient of variance instead of variance [default FALSE]

-l, --clr_trans
	use centered log-ratio transformation instead of relative abundance [default FALSE]

-a, --all
	plot all samples without a mapping file (this outputs no
          statistics) [default FALSE]

-w, --shotgun
	Data is metagenomic shotgun data
          (picked against RefSeq database) [default FALSE]

-h, --help
	Show this help message and exit
附录2. 安装所有依赖R包并测试
# 运行R
R

# 安装13个依赖包,环境为Ubuntu16.04 + R3.4.1,祝你成功
source("https://bioconductor.org/biocLite.R")
biocLite(c("optparse", "beeswarm", "RColorBrewer", "reshape2", "plyr", "grid", "gridExtra", "ggplot2", "RJSONIO", "biom", "Matrix", "labeling", "digest"))

# 测试是否安装成功
library("optparse")
library("beeswarm")
library("RColorBrewer")
library("reshape2")
library("plyr")
library("grid")
library("gridExtra")
library("ggplot2")
library("RJSONIO")
library("biom")
library("Matrix")
library("labeling")
library("digest")
q()
附录3. 常见错误
- otu表格式错误
[1] "Loading Inputs..."
Error in load.inputs(otu_table, map, mapcolumn, groups) :
Error: otu table must be either .txt or .biom (json)
Execution halted
解决方法:要求扩展名符合要求,如文本表必须为.txt结尾,更正即可
- 输出目录己存在
Error: Output directory already exists
Execution halted
程序防止覆盖结果,手动删除输出目录即可,或换个不存在的输出目录
- 发表于 2017-12-15 08:31
- 阅读 ( 8555 )
- 分类:其他组学
你可能感兴趣的文章
相关问题
- Co-occurrence网络图在R中的实现 0 回答
- 有扩增子的详细视频教程吗? 1 回答
