分享一个画堆积柱状图的函数代码
library(ggplot2)
library(tidyverse)
library(reshape2)
plotMutiBar=function(dat,ist=F,xlb='',ylb='',lineCol='black',lineW=0.5,legTitle='Group',showValue=F,showLine=T){
if(ist){...
library(ggplot2)
library(tidyverse)
library(reshape2)
plotMutiBar=function(dat,ist=F,xlb='',ylb='',lineCol='black',lineW=0.5,legTitle='Group',showValue=F,showLine=T){
  if(ist){
    dat=t(dat)
  }
  lbc=colnames(dat)
  lbr=row.names(dat)
  df=data.frame(bg=paste0('R',1:nrow(dat)),dat)
  colnames(df)=c('bg',paste0('C',1:(ncol(dat))))
  pg=ggplot(melt(df), aes(x=variable, y=value, fill=bg))+geom_bar(stat = "identity", width=lineW, col=lineCol)
  if(showLine){
    for (i in 2:(ncol(df)-1)) {
      tmp=df[order(df[,1],decreasing = T),]
      tmp[,i]=cumsum(tmp[,i])
      tmp[,i+1]=cumsum(tmp[,i+1])
      colnames(tmp)[c(i,i+1)]=c('STY','ED')
      pg=pg+geom_segment(data=data.frame(tmp,STX=rep(i-0.75,nrow(tmp)),EDX=rep(i-0.25,nrow(tmp))), aes(x=STX, xend=EDX, y=STY, yend=ED))
    }
  }
  if(showValue){
    pg=pg+geom_text(data=melt(df),aes(label=sprintf("%0.2f", round(value, digits = 2))),position=position_stack(vjust=0.5))
  }
  pg=pg+scale_x_discrete(breaks = paste0('C',1:(ncol(dat))),label = lbc)
  pg=pg+scale_fill_discrete(breaks = paste0('R',1:nrow(dat)),label = lbr,name=legTitle)
  pg=pg+labs(x=xlb, y=ylb)
  return(pg)
}
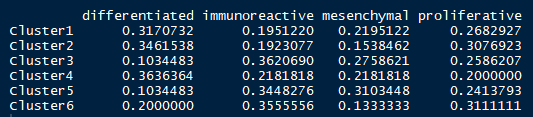
主要输入数据是一个矩阵,有行名称和列名称,如下:
 其他参数默认即可
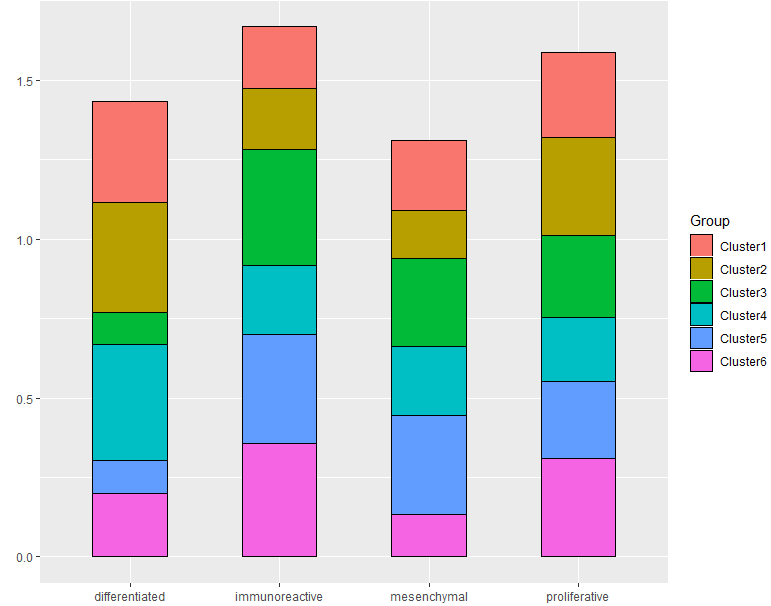
- 发表于 2019-10-15 12:35
- 阅读 ( 4987 )
- 分类:编程语言