R语言基础绘图——坐标轴调整
看教程不够直观,那就看视频吧! >>点击加载视频
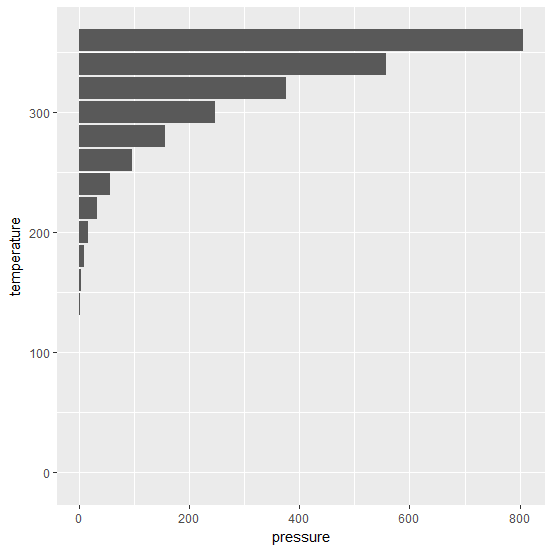
坐标轴翻转 coord_flip()
p<-ggplot(pressure,aes(x=temperature,y=pressure))+geom_bar(stat="identity")
p+coord_flip()
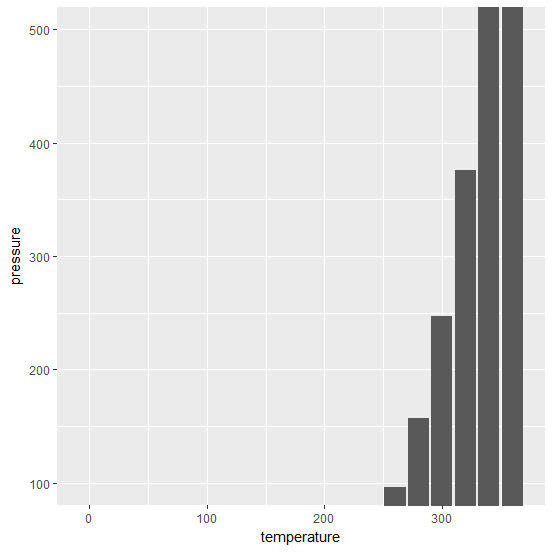
坐标轴值域(三种方式)
p+ylim(0,850)
p+scale_y_continuous(limits=c(100,500))
p+coord_cartesian(ylim=c(100,500))
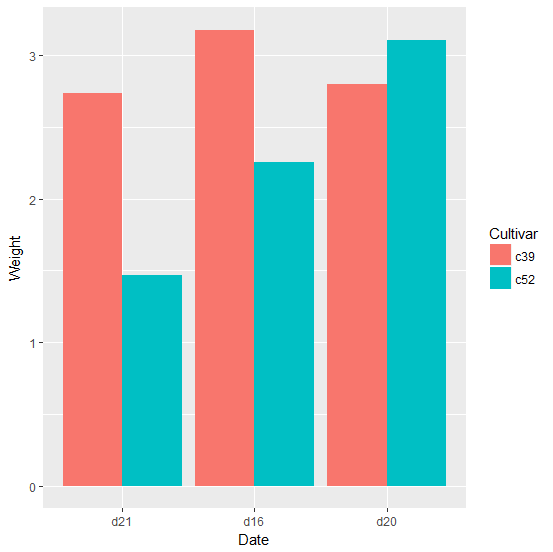
坐标轴项目顺序调整
q<-ggplot(cabbage_exp,aes(x=Date,y=Weight,fill=Cultivar))+geom_bar(position="dodge",stat="identity")
q+scale_x_discrete(limits=c("d21","d16","d20")) ##顺序调整
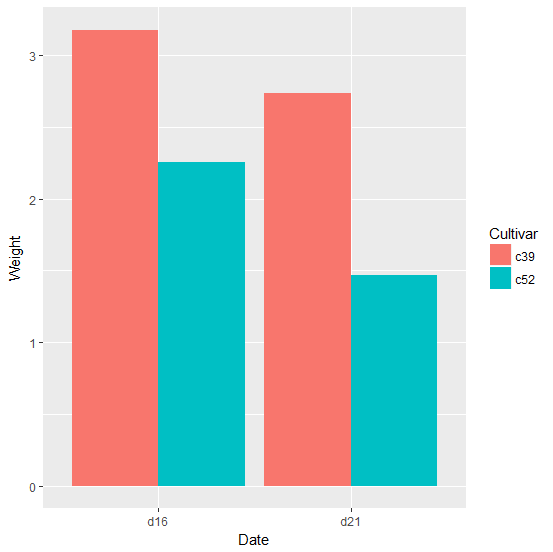
q+scale_x_discrete(limits=c("d16","d21")) ##取出子集
设置刻度线位置
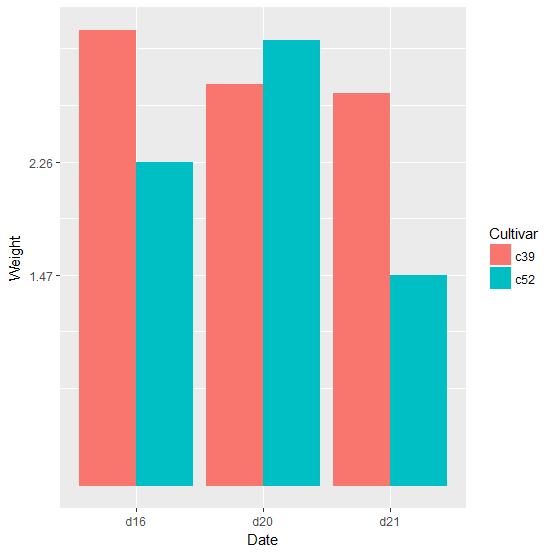
q+scale_y_continuous(breaks=c(1.47,2.26))
#也可以用这样的形式seq(0:3,by=.5)
移除刻度线及标签
q+theme(axis.text.y=element_blank())
q+theme(axis.ticks.y=element_blank())
修改刻度标签的文本
q+scale_y_continuous(breaks=c(0.5,1.5,2.5,3.2),labels=c("Tiny","Short","Medium","high"))
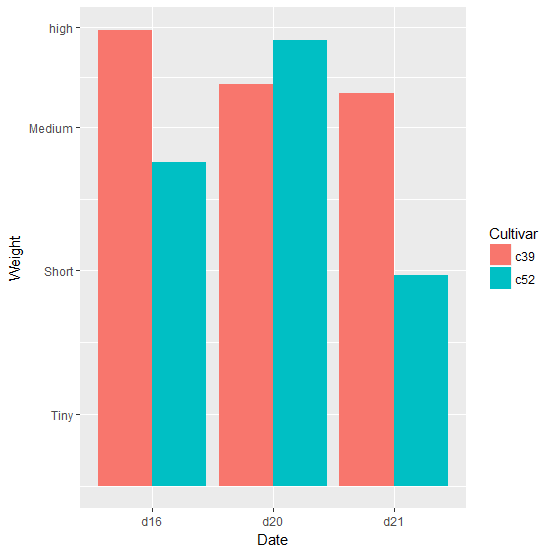
q+scale_x_discrete(breaks=c("d16","d20","d21"),labels=c("date16","date20","date21"))+theme(axis.text.x=element_text(angle=30))
修改坐标轴标签的文本
q+xlab("date of cabbage")+ylab("Weight of cabbage")

移除坐标轴标签
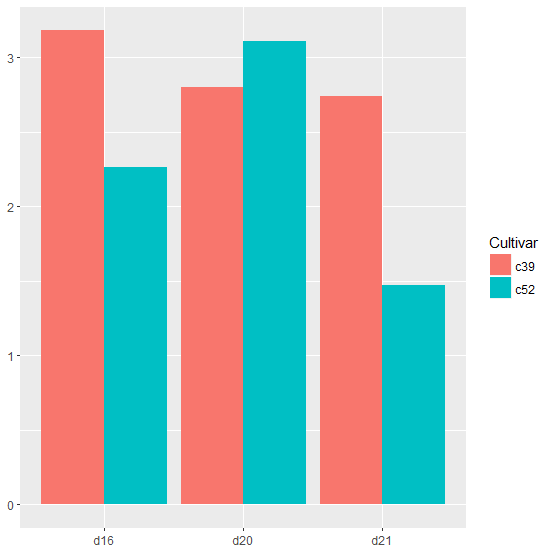
q+theme(axis.title=element_blank())
#theme(axis.title.x =element_blank())
#theme(axis.title.y =element_blank())
修改坐标轴标签的外观
q+theme(axis.title.x=element_text(face="italic",colour="darkred",size=14)) 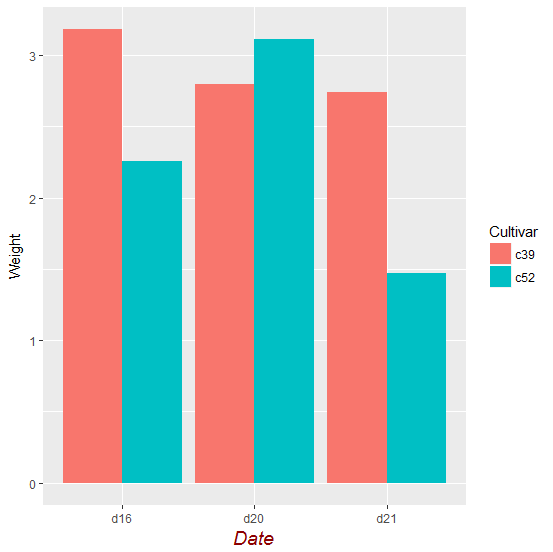
沿坐标轴显示直线
q+theme(axis.line=element_line(colour="black",size=2))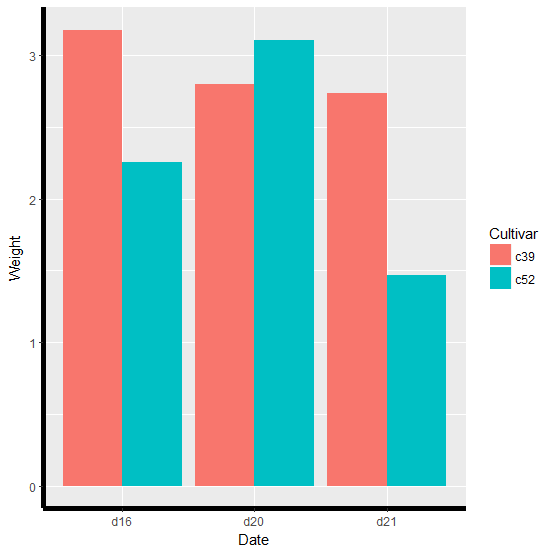
- 发表于 2017-08-06 16:15
- 阅读 ( 17023 )
- 分类:编程语言
你可能感兴趣的文章
- R语言基础绘图——3D散点图 12438 浏览
- R语言基础绘图——饼图 19296 浏览
- R语言基础绘图——韦恩图 16403 浏览
- R语言基础绘图——注解 10106 浏览
- R语言基础绘图——线性回归 17579 浏览
相关问题
- 请问R语言如何实现这种图? 1 回答
- 用r的boxplot做箱线图如何加上具体数据点? 2 回答
