R语言基础绘图——注解
看教程不够直观,那就看视频吧! >>点击加载视频
p<-ggplot(heightweight,aes(x=ageYear,y=heightIn,colour=sex))+geom_point()
添加文本注解annotate()
p+annotate("text",x=16,y=52,label="important",fontface="italic",colour="darkred",size=3)
#label:添加注释文本内容
#fontface:设置字体
#colour:设置颜色
#size:设置字体大小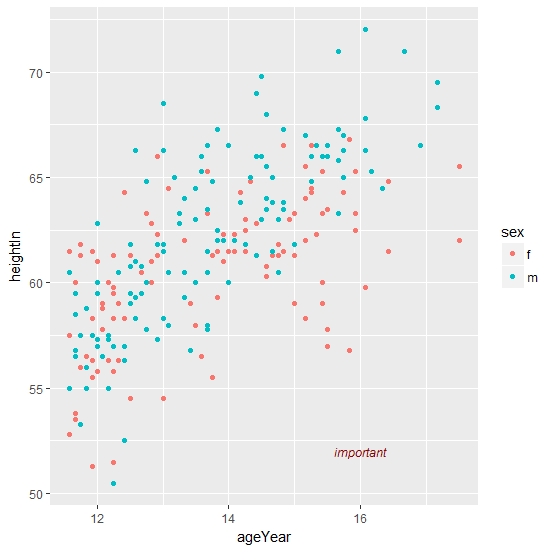
绘制区域边缘文本
p+annotate("text",x=-Inf,y=Inf,hjust=-.2,vjust=2,label="Upper left")
#x=-lnf或lnf 表示左边缘或右边缘
#y=-lnf或lnf 表示下边缘或上边缘
#hjust=* 表示水平方向,若>0沿水平方向向左移动,反之向右移动
#vjust=* 表示竖直方向,若>0沿竖直方向向下移动,反之向上移动

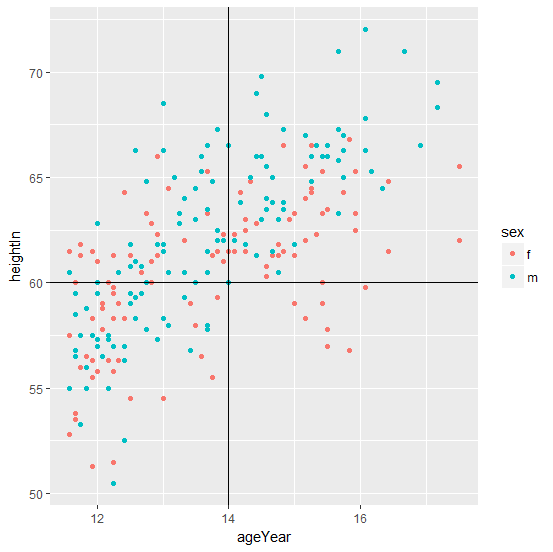
添加直线
p+geom_hline(yintercept=60)+geom_vline(xintercept=14)
#geom_hline(yintercept=*) 表示添加水平线,y轴截距为*
#geom_vline(xintercept=*) 表示添加数值线,x轴截距为*
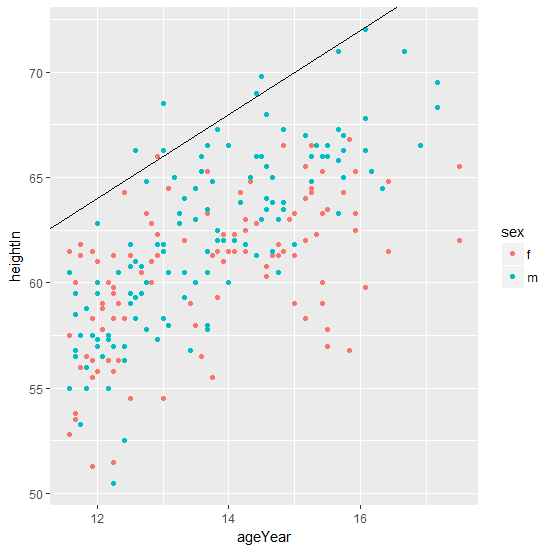
添加斜线段
p+geom_abline(intercept=40,slope=2)
#intercept=* 表示截距
#slope=* 表示斜率
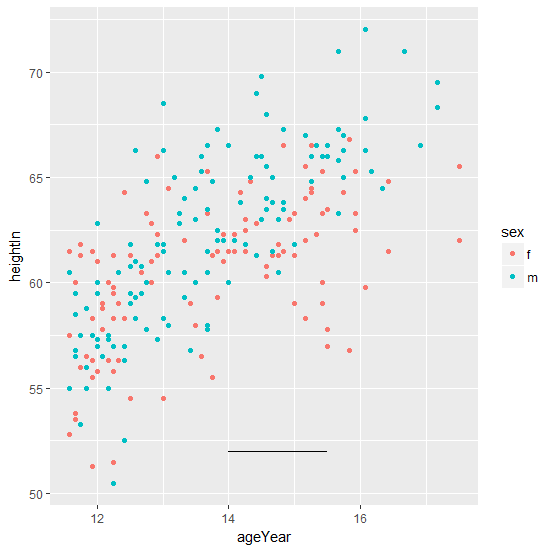
添加线段
p + annotate("segment", x = 14, xend = 15.5, y = 52, yend = 52)
#segment:表示添加线段
#x、xend:表示x坐标起始和终止位置
#y、yend:表示y坐标起始和终止位置
添加箭头
p+ annotate("segment", x = 13.5, xend = 12, y = 55, yend = 53,col="blue",size=2,arrow=arrow())
+annotate("segment", x = 14, xend = 15.5, y = 52, yend = 52, arrow(ends="both",angle=60,length=unit(0.5,"cm")))
#arrow=arrow() 表示添加箭头,默认单侧箭头30度角
#ends="both" 表示设置为双侧箭头
#angle=* 表示设置箭头角度
#length=unit(0.5,"cm") 表示设置箭头的长度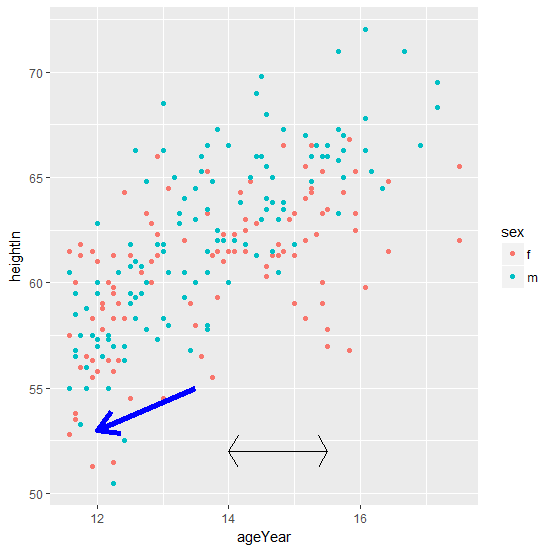
- 发表于 2017-08-06 16:31
- 阅读 ( 10108 )
- 分类:编程语言
你可能感兴趣的文章
- R语言基础绘图——3D散点图 12438 浏览
- R语言基础绘图——饼图 19296 浏览
- R语言基础绘图——韦恩图 16403 浏览
- R语言基础绘图——坐标轴调整 17023 浏览
- R语言基础绘图——线性回归 17579 浏览
相关问题
- 请问R语言如何实现这种图? 1 回答
- 用r的boxplot做箱线图如何加上具体数据点? 2 回答
