R语言基础绘图——柱状图
看教程不够直观,那就看视频吧! >>点击加载视频
采用barplot函数绘制柱状图
library(ggplot2)
library(gcookbook)
cabbage_exp #内置数据,含Cultivar Date Weight sd n se 六列,Cultivar包含c39和c52两类,Date包含d16,d20,d21三类
M<-c(1,2,3,4,5,6)
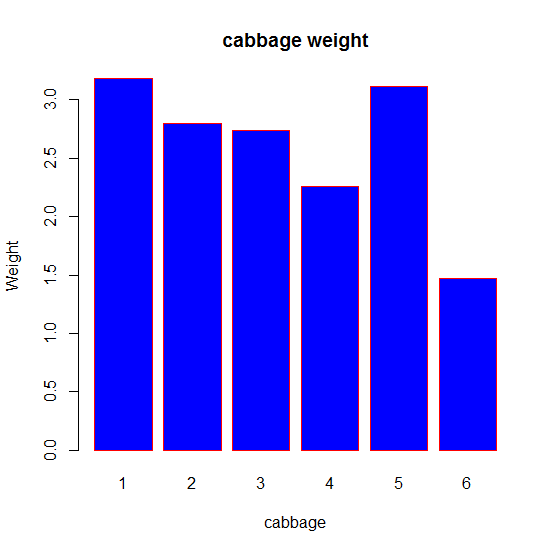
barplot(cabbage_exp$Weight,xlab="cabbage",ylab="Weight",col="blue", main="cabbage weight",border="red")
参数:
① H - 是包含在柱状图中使用数值的矢量或矩阵。
② xlab - 是标签为X轴。
③ ylab - 是标签为Y轴。
④ main - 是柱状图的标题名称
⑤ col - 用于给出在图中的条状的颜色。
⑥ border – 柱状图边框
⑦ names.arg - 是出现在每个条的向量名称。
采用ggplot函数绘制简单柱状图
library(ggplot2)
library(gcookbook)
cabbage_exp #内置数据,含Cultivar Date Weight sd n se 六列,Cultivar包含c39和c52两类,Date包含d16,d20两类
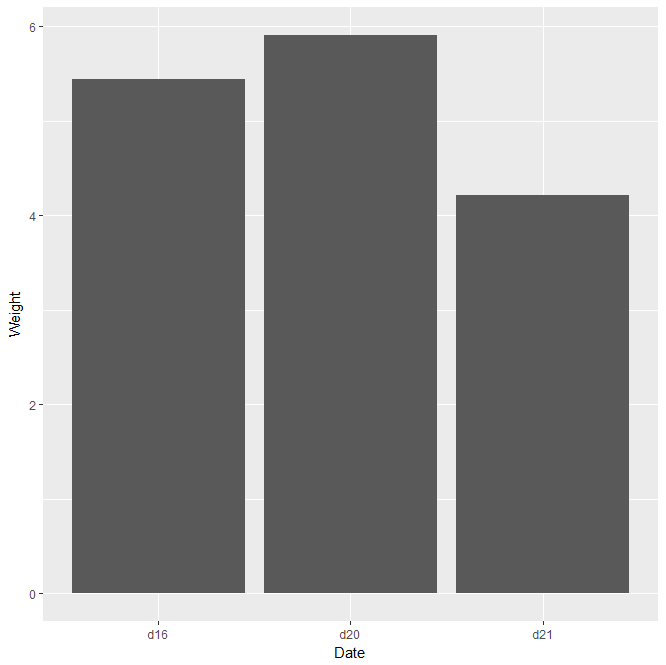
ggplot(cabbage_exp,aes(x=Date,y=Weight))+geom_bar(stat="identity")
美化调整:
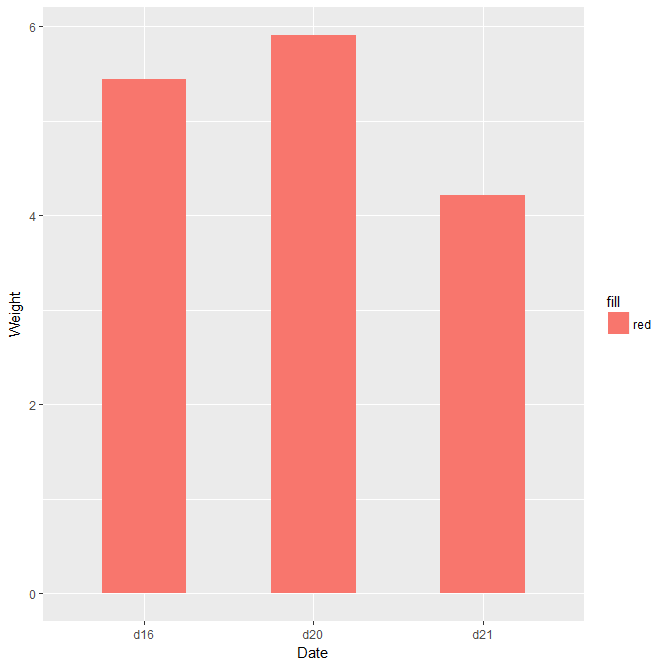
ggplot(cabbage_exp,aes(x=Date,y=Weight,fill="red"))+geom_bar(stat="identity",width=0.5)
① geom_bar():绘制柱状图
② stat="identity":指定了柱状图的高度(y)
③ fill:填充柱状颜色
④ width:调节柱状宽度
采用ggplot函数绘制堆积柱状图
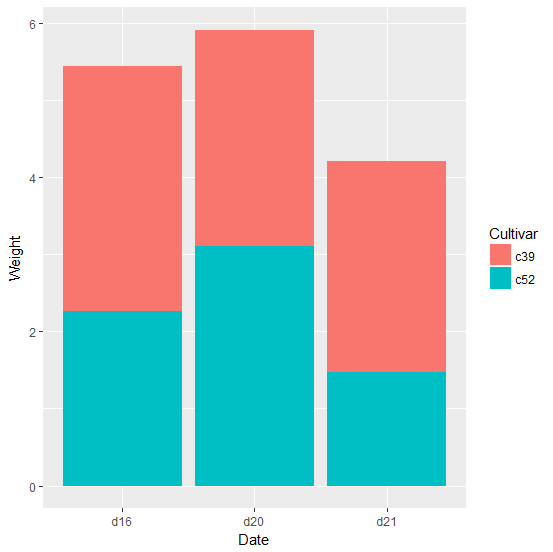
ggplot(cabbage_exp,aes(x=Date,y=Weight,fill=Cultivar))+geom_bar(stat="identity")
采用ggplot函数绘制分组柱状图
ggplot(cabbage_exp,aes(x=Date,y=Weight,fill=Cultivar))+geom_bar(position="dodge",stat="identity")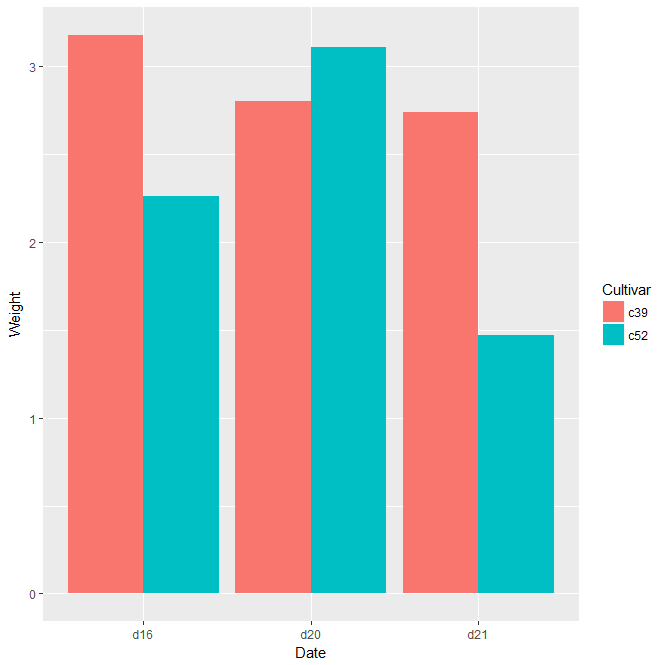
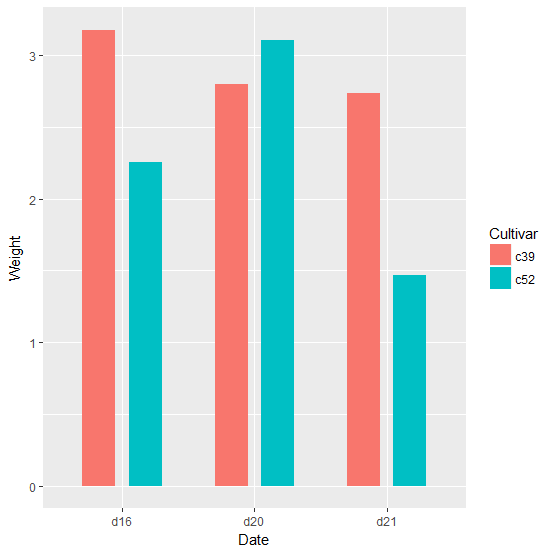
美化调整
ggplot(cabbage_exp,aes(x=Date,y=Weight,fill=Cultivar))+geom_bar(position=position_dodge(0.7),stat="identity",width=0.5)
#position=position_dodge(*):设置两柱相对位置
#也可以使用scale_fill_manual(values=c(*,*)):手动更改柱填充颜色
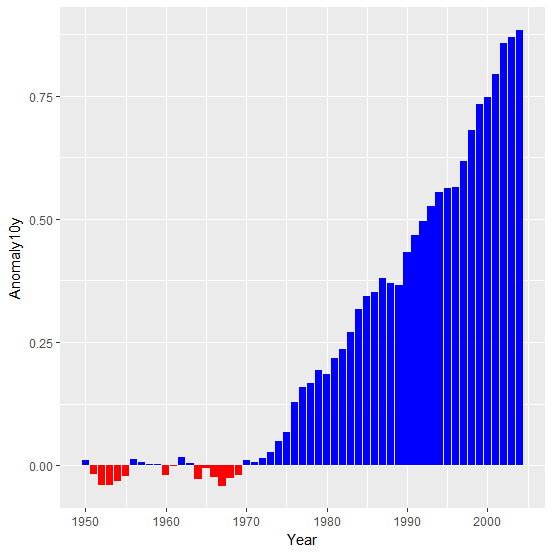
给正值和负值柱状图赋予不同颜色
取出部分数据
climate_part<- subset(climate, Source=="Berkeley" & Year >= 1900) ggplot(climate_part,aes(x=Year,y=Anomaly10y))+geom_bar(stat="identity")
对>0的值赋TURE,否则赋FALSE,并对p分组
climate_part$p<-climate_part$Anomaly10y>0
ggplot(climatepart, aes(x=Year, y=Anomaly10y, fill=p)) +geom_bar(stat="identity")+scale_fill_manual(values=c("red","blue"),guide=FALSE)
#guide=FALSE取消示例图标
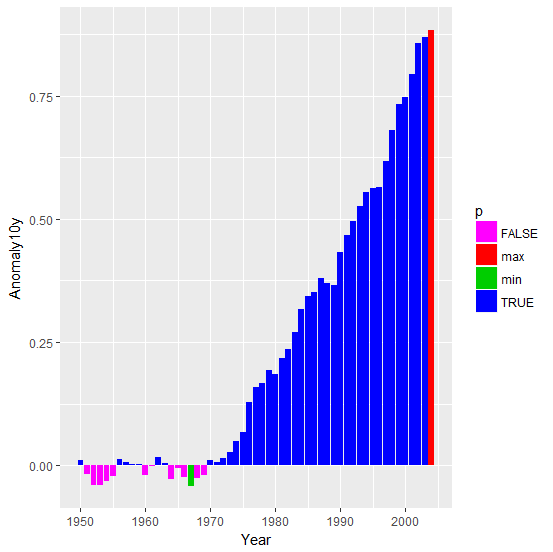
进一步标明最大值最小值所在
rowmax<-which(climatepart$Anomaly10y==max(climatepart$Anomaly10y))
rowmin<-which(climatepart$Anomaly10y==min(climatepart$Anomaly10y))
ggplot(climatepart, aes(x=Year, y=Anomaly10y, fill=p)) +geom_bar(stat="identity")+scale_fill_manual(values=c(6,2,3,4))
#颜色可进行进一步美观调整
- 发表于 2017-07-22 18:44
- 阅读 ( 18255 )
- 分类:编程语言
你可能感兴趣的文章
- R语言基础绘图——3D散点图 12448 浏览
- R语言基础绘图——饼图 19311 浏览
- R语言基础绘图——韦恩图 16414 浏览
- R语言基础绘图——注解 10118 浏览
- R语言基础绘图——坐标轴调整 17028 浏览
- R语言基础绘图——线性回归 17590 浏览
相关问题
- 请问R语言如何实现这种图? 1 回答
- 用r的boxplot做箱线图如何加上具体数据点? 2 回答
