R语言基础绘图——面积图
看教程不够直观,那就看视频吧! >>点击加载视频
为了了解整体数据在不同阶段下的不同成分构成,
在不同阶段的水平值(数据分组的数目)较少时,通常采用条形图和柱状图;
在不同阶段的水平值(数据分组的数目)较多时,通常采用面积图或堆积面积图。
加载ggplot2包
library("ggplot2")
采用ggplot函数绘制普通面积图
ggplot(pressure,aes(temperature,pressure))+geom_area()
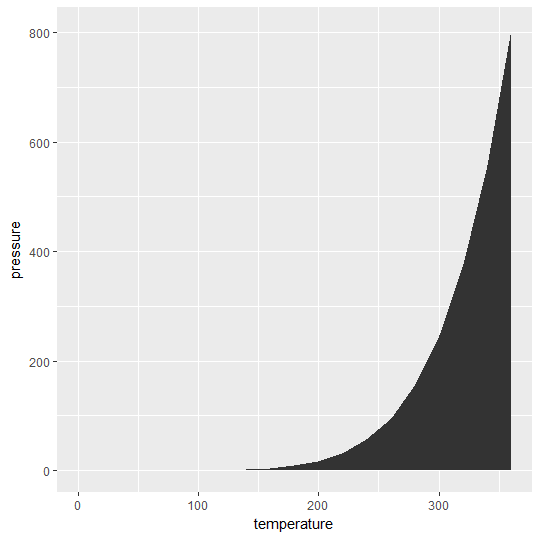
对面积图颜色、透明度以及标签进行设置:
ggplot(pressure,aes(temperature,pressure))+geom_area(fill="blue",alpha=0.3)+labs(title ="picture")+xlab("温度")+ylab("压强")
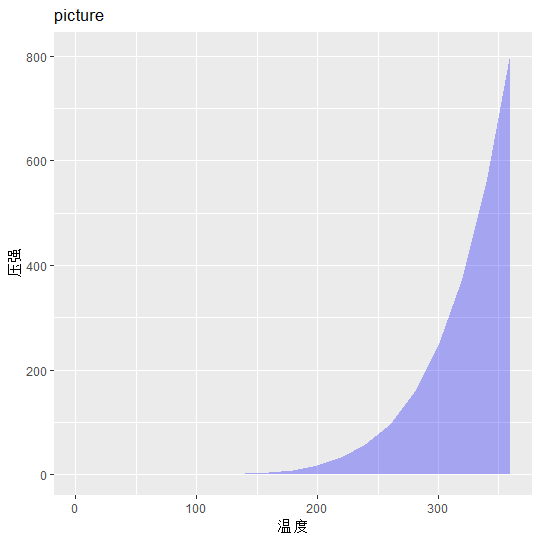
采用ggplot函数绘制堆积面积图
数据:
library("gcookbook")
head(uspopage)
Year AgeGroup Thousands
1 1900 <5 9181
2 1900 5-14 16966
3 1900 15-24 14951
4 1900 25-34 12161
5 1900 35-44 9273
6 1900 45-54 6437
默认情况下,加入分类变量之后的面积图的位置调整参数为堆积
ggplot(uspopage,aes(Year,Thousands,fill=AgeGroup))+geom_area()
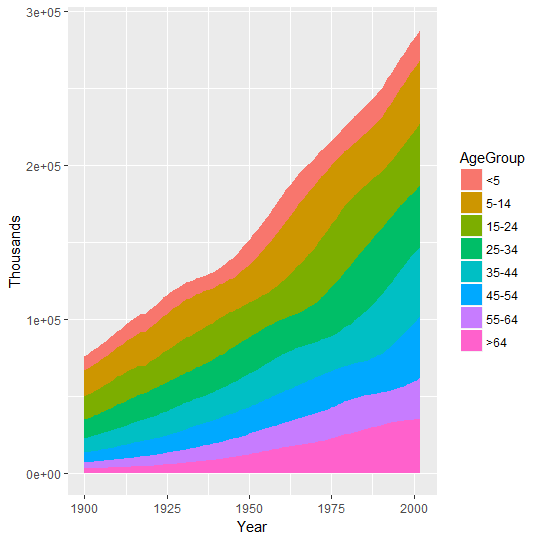
我们可以通过添加位置参数position进行确认:position="stack"或position="identity"
ggplot(uspopage,aes(Year,Thousands,fill=AgeGroup))+geom_area(position="stack") #与默认情况相同
ggplot(uspopage,aes(Year,Thousands,fill=AgeGroup))+geom_area(position="identity")
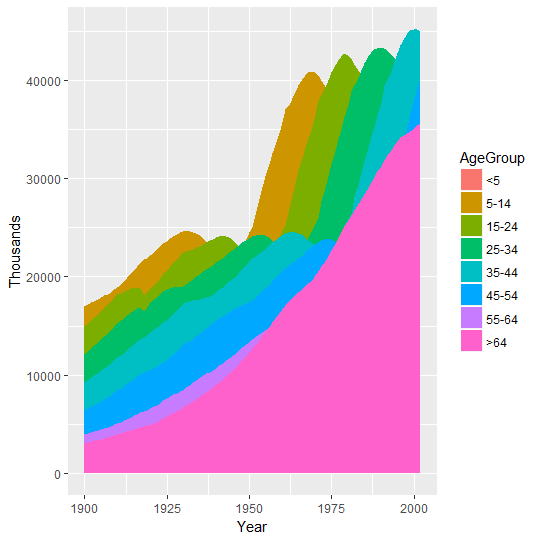
美化:各分组数据有大小关系,可将调色板设置为渐变色。
ggplot(uspopage,aes(Year,Thousands,fill=AgeGroup))+geom_area()+scale_fill_brewer(palette = "Blues")
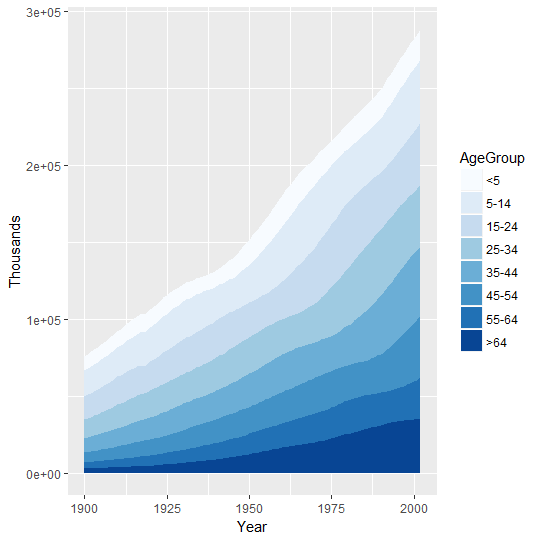
调色标尺:breaks反转图例顺序
ggplot(uspopage,aes(Year,Thousands,fill=AgeGroup))+geom_area()+scale_fill_brewer(palette = "Blues", breaks = rev(levels(uspopage$AgeGroup)))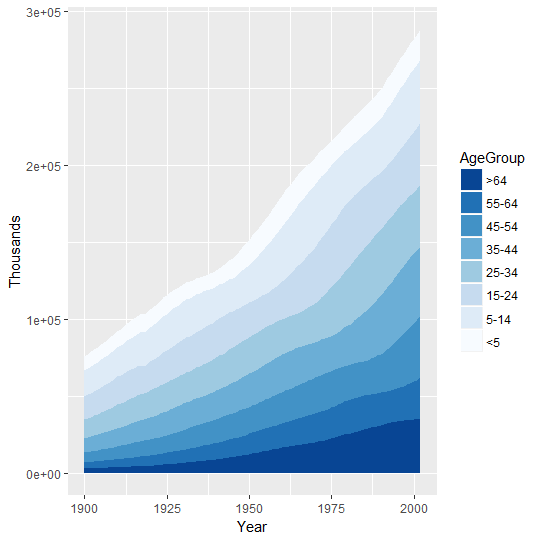
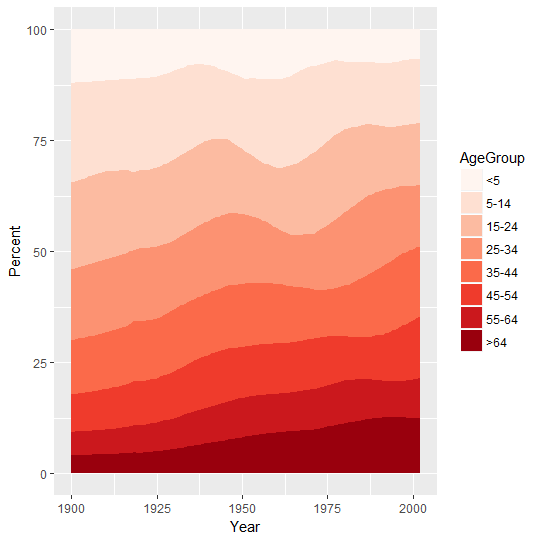
如果需要绘制百分比堆积图,只需要原数据进行如下更改
加载plyr包
library("plyr")
uspopage_per = ddply(uspopage, "Year", transform, Percent = Thousands / sum(Thousands) * 100)
查看更改后数据:增加Precent一列数值
head(uspopage_per)
Year AgeGroup Thousands Percent
1 1900 <5 9181 12.065340
2 1900 5-14 16966 22.296107
3 1900 15-24 14951 19.648067
4 1900 25-34 12161 15.981549
5 1900 35-44 9273 12.186243
6 1900 45-54 6437 8.459274
对修改后的数据按照上述方式画图即可
ggplot(uspopage_per,aes(Year,Percent,fill=AgeGroup))+geom_area()+scale_fill_brewer(palette = "Reds")
- 发表于 2017-07-25 08:51
- 阅读 ( 11883 )
- 分类:编程语言
你可能感兴趣的文章
- R语言基础绘图——3D散点图 12452 浏览
- R语言基础绘图——饼图 19321 浏览
- R语言基础绘图——韦恩图 16427 浏览
- R语言基础绘图——注解 10125 浏览
- R语言基础绘图——坐标轴调整 17032 浏览
- R语言基础绘图——线性回归 17594 浏览
相关问题
- 请问R语言如何实现这种图? 1 回答
- 用r的boxplot做箱线图如何加上具体数据点? 2 回答
