R语言基础绘图——气泡图
气泡图
散点图一般只能展示二维数据,气泡图则可以在其基础上通过三点的大小来表达其他信息。
采用symbols创建气泡图:
数据
diamond<-diamonds[0:15,]
diamond
# A tibble: 15 × 10
carat cut color clarity depth table price x y z
<dbl> <ord> <ord> <ord> <dbl> <dbl> <int> <dbl> <dbl> <dbl>
1 0.23 Ideal E SI2 61.5 55 326 3.95 3.98 2.43
2 0.21 Premium E SI1 59.8 61 326 3.89 3.84 2.31
3 0.23 Good E VS1 56.9 65 327 4.05 4.07 2.31
4 0.29 Premium I VS2 62.4 58 334 4.20 4.23 2.63
5 0.31 Good J SI2 63.3 58 335 4.34 4.35 2.75
6 0.24 Very Good J VVS2 62.8 57 336 3.94 3.96 2.48
7 0.24 Very Good I VVS1 62.3 57 336 3.95 3.98 2.47
8 0.26 Very Good H SI1 61.9 55 337 4.07 4.11 2.53
9 0.22 Fair E VS2 65.1 61 337 3.87 3.78 2.49
10 0.23 Very Good H VS1 59.4 61 338 4.00 4.05 2.39
11 0.30 Good J SI1 64.0 55 339 4.25 4.28 2.73
12 0.23 Ideal J VS1 62.8 56 340 3.93 3.90 2.46
13 0.22 Premium F SI1 60.4 61 342 3.88 3.84 2.33
14 0.31 Ideal J SI2 62.2 54 344 4.35 4.37 2.71
15 0.20 Premium E SI2 60.2 62 345 3.79 3.75 2.27
symbols(diamond$depth,diamond$prize,inches=0.2,circle=diamond$carat)
 美化:
美化:
symbols(diamond$depth,diamond$price,inches=0.2,circle=diamond$carat,
fg="white",bg="red",main="part of diamonds", ylab="price of diamond", xlab="depth of diamond")
text(diamond$depth,diamond$price,diamond$cut,cex=0.5)

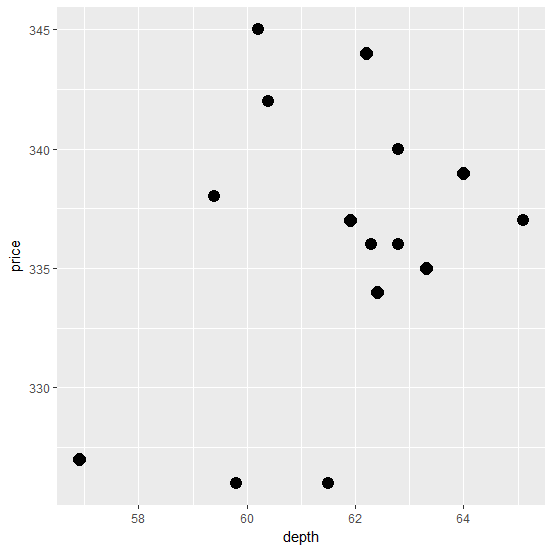
采用ggplot创建气泡图:
ggplot(diamond,aes(depth,price))+geom_point(size=diamond$y)
美化:
颜色及标题:
ggplot(diamond,aes(depth,price))+geom_point(size=c(1:15),shape=17,color=7)+labs(title ="气泡图")+xlab("depth of diamond")
+ylab("price of diamond")+theme(plot.title=element_text(hjust=0.5))

添加文本标签:
ggplot(diamond,aes(depth,price))+geom_point(size=c(1:15),color=7)
+annotate("text",x=diamond$depth,y=diamond$price,label=diamond$cut,fontface="italic",colour="darkred",size=3)

- 发表于 2017-08-02 20:20
- 阅读 ( 18001 )
- 分类:编程语言
